Displacement Work
Consider a piston cylinder arrangement as given in the Figure 2.4. If the pressure of the fluid is greater than that of the surroundings, there will be an unbalanced force on the face of the piston. Hence, the piston will move towards right.
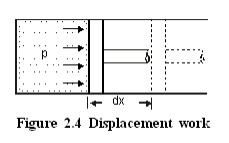
Force acting on the piston =Pressure ´Area
=pA
\ Work done =Force ´distance
=pA ´dx
=pdV
where dV - change in volume.
This work is known as displacement work or pdV work corresponding to the elemental displacement dx. To obtain the total work done in a process, this elemental work must be added from the initial state to the final state. Mathematically, .
Evaluation of Displacement Work
Constant Pressure Process
Figure 2.5 shows a piston cylinder arrangement containing a fluid. Let the fluid expands such that the pressure of the fluid remains constant throughout the process. Figure 2.6 shows the process in a p-V diagram.
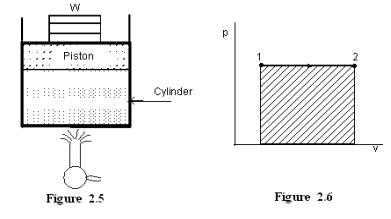
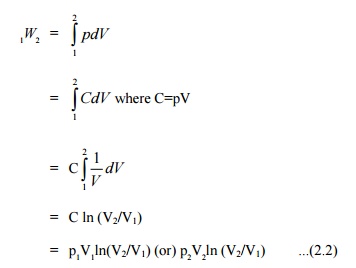
The mathematical expression for displacement work can be obtained as follows:
=p(V2 –V1) ...(2.1)
This expression shows that the area under a curve in a p-V diagram gives work done in the process.
Constant volume process
Consider a gas contained in a rigid vessel being heated. Since there is no change in volume, the displacement work .
Hyperbolic process
Let the product of pressure and volume remains constant at all the intermediate states of a process. In the p-V diagram it will be a hyperbola as given in Figure 2.7.
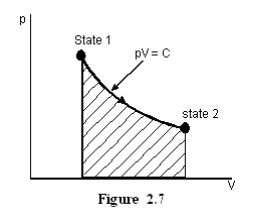
For Ideal gases when temperature remains constant, pV will be constant i.e., isothermal process are hyperbolic processes for an ideal gas.
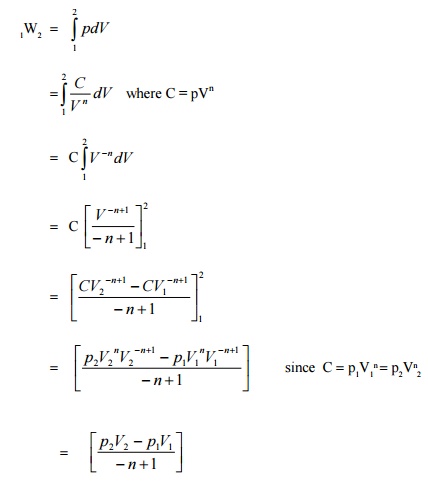
Polytropic Process
Any process can be represented by the general form pVn =constant. Based on the valve of n, the process differs as given below;For other values of n, the process is known as polytropic process. Figure
2.8 shows the polytropic processon-V coordinatesofvarious.Expression possi for displacements work for a polytropic process can be obtained as follows :
Work is a Path Function
Consider a working substance initially occupying 0.2 m3 at 1 bar as represented by state 1 in the Figure 2.9. Let the system changes its state such that the final volume is 0.05m3 and pressure 2 bar. The change of state may occur along the paths 1A2,1B2 or 1C2. As mentioned earlier, area under the curve representing the process in a p-V diagram gives the work done in the process. Comparing the area under the paths 1A2, 1B2 and 1C2, it is clear that the work done in these paths are different. Hence it can be concluded that the amount of work done is not only a function of the end states of a process, but also the path followed between the states. Therefore work is a path function.
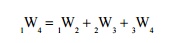
Additivity of Work Over Processes
If a system is taken through two or more number of processes, the total work done is the sum of work done in the individual processes.
Let a system executes three processes as shown in Figure 2.10. The total work done,